alphafold-simple-recipes
Add pLDDT as bfactor to pdb
import pickle
from Bio.PDB import *
import numpy as np

io = PDBIO()
p = PDBParser()

offset=1

for i in range(1,6):
    I = str(i)
    with open("T1050/result_model_"+I+".pkl","rb") as pic:
        data = pickle.load(pic)

    plddt = data['plddt']

    structure = p.get_structure("R1", "T1050/relaxed_model_"+I+".pdb")

    j=0
    for model in structure:
        for chain in model:
            for residue in chain:
                resnum = int(residue.get_id()[1])
                for atom in residue:
                    atom.set_bfactor(plddt[j+offset-1])
                        j+=1

    io.set_structure(structure)
    io.save("relaxed_model_plddt_"+I+".pdb", preserve_atom_numbering = True, )
There is a simple working script available at /software/alphafold/simple-recipes/add_plddt_as_bfactor_to_pdb.py:
/software/alphafold/simple-recipes/add_plddt_as_bfactor_to_pdb.py -h
usage: add_plddt_as_bfactor_to_pdb.py [-h] -p PICKLE -i INPUT -o OUTPUT [-m]
[-O OFFSET]
Add bfactor from pickle to pdb
optional arguments:
-h, --help show this help message and exit
-p PICKLE, --pickle PICKLE
alphafold pickle file
-i INPUT, --input INPUT
pdb input file
-o OUTPUT, --output OUTPUT
residue number of first residue in pdb input file
-m, --plot plot plddt and original bfactor
-O OFFSET, --offset OFFSET
pdb output file
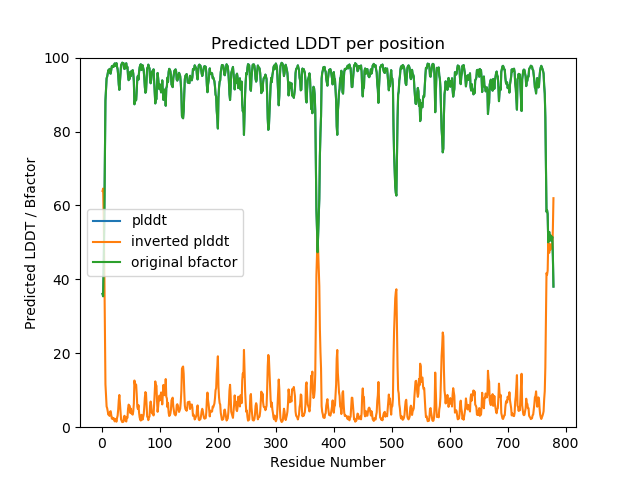
/software/alphafold/simple-recipes/add_plddt_as_bfactor_to_pdb.py -p T1050/result_model_1.pkl -i T1050/relaxed_model_1.pdb -o test.pdb -m
That should create the pdb-file, and a simple plot like the one below. In this case, the input-file contained already pLDDT as bfactors, so plots perfectly overlap:
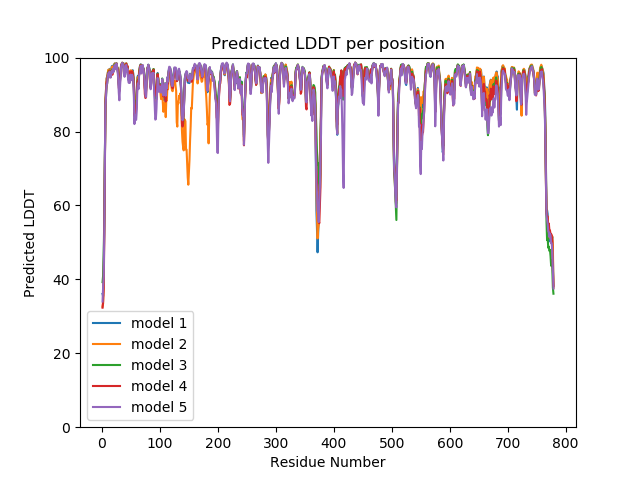
Plot pLDDT
import pickle
from Bio.PDB import *
import matplotlib.pyplot as plt
import numpy as np
from matplotlib import cm

offset = 1
for i in range(1,6):
    I = str(i)
    with open("T1050/result_model_"+I+".pkl","rb") as pic:
        data = pickle.load(pic)
    plddt = data['plddt']
    idx = np.arange(len(plddt)) + offset
    plt.plot(idx,plddt,label='model '+I)

plt.title('Predicted LDDT per position')
plt.xlabel("Residue Number")
plt.ylabel("Predicted LDDT")
plt.ylim(ymax=100, ymin=0)
plt.legend()
plt.show()